05/07 - Behind the Rally: Warning Signs You Can’t Ignore
Bond yields, oil, and currencies are flashing red while stocks grind higher. Here’s what comes next.
Although stock futures are advancing on progress in US-China talks, several key market indicators are now painting a much more bearish picture of what may come. Specifically, I’ve been monitoring:
US 2-year Treasury yield
Oil prices
USDTWD
2-Year Treasury Yield
US Treasury Secretary Scott Bessent has been pushing for a rate cut, noting that the 2-year yield is now below the Fed funds rate (3.80% vs. 4.33%). This signals that the market is betting the Fed will need to ease policy soon - typically because economic growth is slowing and a recession may be on the horizon.
Although the Fed doesn’t control the 2-year yield directly, this is the bond market’s way of warning that current monetary policy may be too tight and that a pivot is needed.
Historically, this setup preceded both the 2020 pandemic crash and the 2008 financial crisis, having first appeared in March 2019 and June 2006, respectively.
Oil Prices
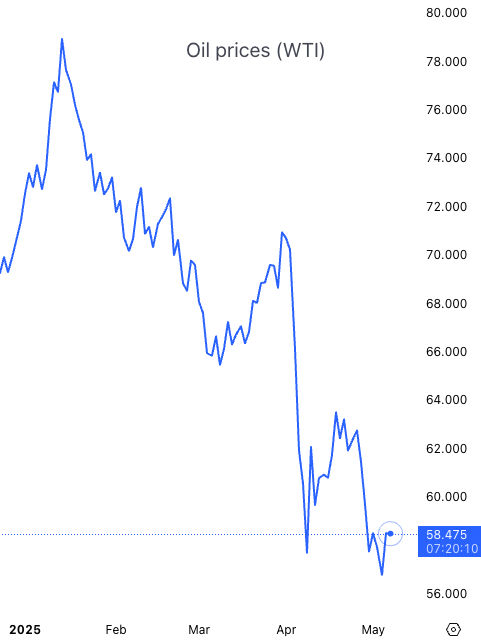
Oil saw a dramatic drop earlier this week after OPEC+ moved to expedite output increases, raising fears of oversupply in the face of weakening demand.
While falling oil prices can appear positive at first (i.e., cheaper gas, lower input costs), sharp and sudden declines tend to spook markets because:
They suggest a global slowdown may be underway due to demand destruction.
They can trigger disinflation, causing consumers and businesses to delay spending in anticipation of lower prices.
Energy sector weakness can drag down broader market performance.
Oil-exporting economies (e.g., Saudi Arabia, Russia) may feel pressure, leading to global ripple effects.
USDTWD
The USD/TWD (US Dollar vs. Taiwanese Dollar) just saw its biggest move in decades—a historic event that stunned global investors and raised new questions about what lies ahead.
This sharp appreciation in the Taiwanese Dollar likely reflects central bank intervention aimed at reshaping Taiwan’s export dynamics. As I’ve said in my Pre-Market Lives, US-China discussions are about far more than tariffs—they’re a strategic tug-of-war over AI supremacy.
Taiwan, as a critical node in the global semiconductor supply chain, becomes a pressure point in this battle. A stronger TWD could hurt exporter margins and discourage chipmakers from prioritizing US buyers.
Over time, this could drag on global tech and AI names—particularly those exposed to TSMC, such as NVIDIA, AMD, Supermicro, Dell, HP, Microsoft, Amazon, and Google.

So What Do We Do About It?
Keep reading with a 7-day free trial
Subscribe to Delta Edge | Stock Signals to Beat the Market to keep reading this post and get 7 days of free access to the full post archives.


